Contact Us

Use the form on the right to contact us.

You can edit the text in this area, and change where the contact form on the right submits to, by entering edit mode using the modes on the bottom right. 


123 Street Avenue, City Town, 99999

(123) 555-6789

email@address.com


You can set your address, phone number, email and site description in the settings tab.
Link to read me page with more information.

Blog

Filtering by Tag: MLS

Valuing The MLS SuperDraft

Ford Bohrmann

The draft can be a valuable tool to build a successful club in MLS. When expansion teams come into the league they are automatically given the top draft picks. The list of players that entered MLS through the draft is telling. Some of the top goal scorers: Clint Dempsey, Taylor Twellman, Edson Buddle, Brian Ching. Some of the players with the most minutes: Nick Rimando, Brad Davis, Nick Garcia, Brian Carroll. The list goes on.


Some of these players I’ve mentioned were top picks. Brian Carroll was selected 2nd overall in 2000. Taylor Twellman was selected 2nd overall in 2000. Some of the top players who were chosen in the draft were selected in the later rounds, but went on to very successful careers. Chris Rolfe was selected 29th overall. Davy Arnaud was selected 57th overall and scored 54 goals in his career.

On the flip side, there are a number of notable draft busts. Nikolas Besagno was selected 1st overall in 2005 and went on to play in only 8 games. Joseph Ngwenya went 3rd overall in 2004 to Salt Lake and scored 18 goals in his career, while Salt Lake passed over Clint Dempsey, Clarence Goodson and Michael Bradley.

This post aims to provide some context around the value of draft positions. This can be helpful for determining a fair trade (“Should I trade up to a higher selection?”) or looking at how clubs have performed in their draft selections (apparently the Rapids have done a pretty crappy job overall).

Read More

Does More Possession=More Wins in the MLS?

Ford Bohrmann

In the past couple of blog posts I've looked at two common statistics and shown that they are not as meaningful as most people believe. shots on goal do not predict success very well, and assists favor players on better clubs. In keeping with this theme of misleading statistics in football, I decided to look at possession data. The commonly held notion is that the team that has the ball more (has a possession percent over 50) is more likely to win. This makes sense. A team with the ball more is more likely to score and less likely to concede. But does the data back it up? Does having more possession than your opponent mean you are more likely to win the game? I looked at the possession data from the MLS season so far. What I found goes completely against what most people would think. So far this season in the MLS, the average possession percentage for teams that have won the game is 48.5%. Teams that win actually posses the ball less. This means the average possession percentage for losing teams is 51.5%.

To get even more specific, I broke down the possession data further. Winning home teams average 50.9% possession, and winning away teams average 43.4% possession. On the other side, losing home teams average 56.6% possession and losing away teams average 49.1% possession. The histograms below illustrate these facts. I found that away teams, on average, have a possession percentage of 47.3%, and home teams have a possession percentage of 52.7%.

So what does all this mean? It seems possession percentage in the MLS does not predict success. Teams that possess the ball more don't win more; they actually lose more. Home teams also have a slight advantage in possession percentage compared with away teams.

What about teams that completely dominate possession? You might think that a team that had the ball much more often than their opponent would be much more likely to win. I defined "dominating possession" as having the ball more than 60% of the time. So far this season, teams that have dominated possession have a record of 10 wins, 19 losses, and 18 ties. Domination in possession? Yes. Domination in wins? No.

This analysis calls in to question statements like "the Union had the run of play, they possessed the ball more and deserved the win." It's apparent that in the MLS, possession is not all that important when it comes to winning games. So what's the problem with possession? One reason could be that the best teams do not play possession football. The teams with the most success may play kick and run. Another possibility is that possessing the ball simply doesn't lead to wins. Either way, having the ball more than your opponent does not mean much in the MLS.

Do Shots on Goal Matter?

Ford Bohrmann

The major point of this blog is to test commonly held notions in football for their validity. After watching the US women lose to Japan yesterday, I started to think about shots on goal. I don't have the exact numbers, but I'm pretty sure the US crushed Japan in the shots on goal category. This made me think, do shots on goal matter? Most people would quickly say yes. It would make sense that more shots on goal mean more chances to score and thus more goals. The only problem is that some things in football just don't make sense. I wanted to see if shots on goals equate to success in two categories: 1.) Do more shots on goal mean more success for a team as a whole? 2.) Do more shots on goal mean more goals for a specific player? To test these questions I used data from the MLS website. As an aside, mls.com has extensive statistics for every season in a bunch of categories. Great to see. Anyways, the data is from the 2010 MLS season.

First question: Do more shots on goal mean more success for a team as a whole?

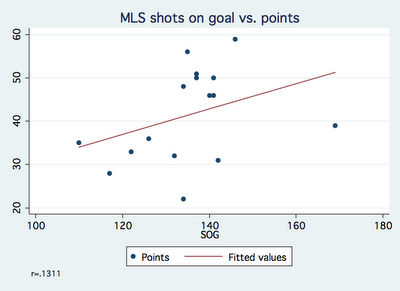
If this was true, we would expect points to increase as shots on goal increase on a team level. In other words, teams that have more shots on goal would be more successful. The graph below tells us a different story.

The graph shows there is no real relationship between shots on goal and points. Most teams cluster around just under 140 shots on goal on the season. The line of best fit shows a positive relationship, but this relationship is not strong at all. The correlation of the graph is r=.1311. As a reminder, the correlation of a graph tells us how strong the linear relationship is between two variables. The correlation coefficient (the value of r) gives a numerical value of the strength of the relationship. A value of 0 means there is no linear relationship at all, and a value of 1 means there is a perfect positive linear relationship. In this case, the value is .1311, telling us there is a very weak linear relationship.

Second question: Do more shots on goal mean more goals for a specific player?

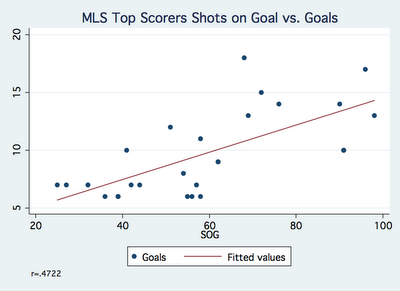
Similar story for this question: is there a linear increase in the amount of goals as the amount of shots on goal increases? The graph below gives us the answer.

This graph shows a stronger relationship compared with the graph above. However, the relationship is still not very strong. The value of r in this case is .4722, indicating that the relationship is stronger than the graph above. However, a correlation under .5 is generally considered to be a weak relationship. This means for individual players, shots on goals are not a very good indicator of goals.

Here's my best explanation for why shots on goal are not a very indicative statistic: Not all shots on goal are the same. There are 40 yard weak rollers that the goalie easily saves, and there are 5 yard shots that the keeper barely gets a hand on. There are weak attempts by a center back getting forward and there are breakaways by forwards. In the shots on goal statistic, in both cases the shots on goal are counted as equivalent. Obviously this makes no sense. A statistic that would be better indicative of goals scored for both questions I looked at above would be shots on goal inside the box. Shots on goal inside the box would get rid of the shots on goal that have no chance of going in. Not all shots inside the box are the same, so we have somewhat of the same problem as shots on goal. However, I assume there would be a much stronger correlation between shots on goal inside the 18 and points, and shots on goals inside the 18 and goals by an individual player. Unfortunately, I don't have the data to back up this claim (working on it). If/when I do get the data from shots inside the box I'll post the graph and the correlation between shots on goal in the box and goals.

Even without the data, the point I'm making is still clear: shots on goal do not equate to more success from a team perspective and do not correlate with goals for individual players very strongly like most people assume they do. There are better statistics than shots on goal. This means statements like "New England had 5 more shots on goal than New York, they dominated the game" and "Donovan had 4 shots on goal in the game, he was due for a goal" are not neccesarily valid. What if New England had a bunch of shots on goal from outside the 18 that never had a chance of going in? And what if Donovan's shots on goal all were weak rollers? Shots on goal are often misleading.