How to Succeed in the EPL: Chances Created and Chance Conversion
Ford Bohrmann
A common statistic that many people have begun to value and notice a lot recently is the chances created statistic. Chances created, according to Opta's website, is defined as "assists plus Key passes" where a Key Pass is "the final pass or pass-cum-shot leading to the recipient of the ball having an attempt at goal without scoring" (Opta is a company that tracks and generates a ton of data in soccer). So basically, any pass that leads to a shot is considered a chance created.

Swansea's Mark Gower is a perfect example of a player highlighted by the chances created statistic.
Chances Created
The appeal of this measure is that it can value players that play on weaker teams better than assists do. For a player on a weaker team, it is harder to record assists since they are playing with teammates that are less likely to score. Chances created is a fairer statistic because it does not value the strength of your teammates as much. Overall, it can highlight creative players that are often overlooked because they are on weaker teams and do not have as many assists.
Do Chances Created Actually Matter?
With all this in mind, I was curious to find the actual worth of the chances created statistic. One way to measure this is to look at how chances created and wins are correlated. To make it a little easier, I looked at the relationship between goals scored and chances created for EPL teams. In other words, do teams that have more chances created score more? Do teams with less chances created score less? The answer, in short, is yes, they are correlated. Below is a scatterplot of the relationship. There is a clear positive relationship between chances created and goals in the EPL last season. The coefficient is statistically different than 0 (p=.000), which tells us that there is extremely strong evidence that there is a positive relationship.

Chance Conversion Percentages
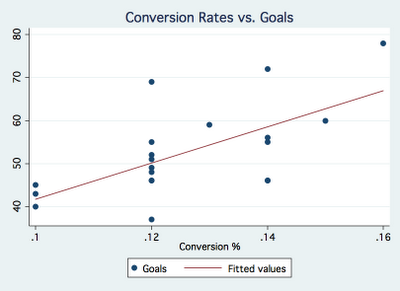
This is only half the story though. Some teams get a lot of shots off, but either because they are not good at shooting or are taking shots that have a smaller chance of going in, some of these teams have a low number of goals because they have a poor conversion percentage for shots. The conversion percentage is defined as the goals divided by the total number of shots (excluding blocked shots). Below is a scatterplot similar to the one above, this time with conversion percentages on the x-axis. The conversion rates are rounded to 2 decimal places, hence the bunching. Again, this shows a positive relationship between conversion percentage and goals. Teams with higher conversion rates tend to score more and vice versa. This relationship is also statistically different from 0 (p=.002). A quick note: the product of chances created and conversion rate is very close to the number of goals a club has scored. I'm pretty sure the discrepancy comes from including blocked shots in shots attempted, but not in conversion rates.

EPL 2010-2011, Chances Created and Conversion %
With this in mind, I created a scatterplot of conversion rates and chances created for EPL teams last season. The plot shows that clubs found scoring success in different ways. The Manchester clubs did it by being efficient scorers; they had conversion percentages of .15 and .16. Chelsea and Tottenham were on the other end of the spectrum with higher chances created, but lower conversion percentages (.12 for both). The graphic also shows that West Ham did not struggle because they were not creating chances; they struggled because they had a low conversion percentage (.10). On the other hand, Birmingham struggled because they failed to create enough chances to score, despite a decent conversion percentage of .12.

EPL 2011-2012 thus far, Chances Created and Conversion %
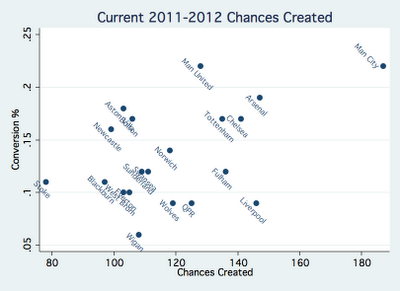
What about this year? Below, I created the same scatterplot as above, this time for the current season. City's dominance is really highlighted. They are leading in both chances created AND conversion percentage, hence the massive number of goals this year. Again, United seems to be scoring because of their high conversion percentage. QPR and United actually have very similar number of chances created, United just finishes their chances with a much higher percentage. Liverpool sticks out because of their high number of chances created, but really low conversion percentage (.09).

Conclusion
The bottom line is that creating chances and conversion rates are the key to understanding goal scoring. A club can succeed with a high conversion rate (United) or by creating a lot of chances (Liverpool). A club can really dominate by doing both well (City). The graphic above can also suggest what kind of players each club needs. For example, Manchester United and Newcastle would benefit by picking up a creative midfielder who creates more chances, and Liverpool and QPR would benefit by picking up a more efficient scorer. The scatterplot also tells us why some clubs struggle. Wigan needs to up their conversion percentage (currently a dismal .06) and Stoke needs to create more chances. City, on the other hand, should just continue to buy all the best players.
All data comes from eplindex.com (@EPLIndex)